Visualizing and quantifying blood flow dynamics
Summary
Supports visualization and quantification of blood flow dynamics by assisting in review of MR phase-contrast data, on vascular region of interest segmented manually, or semi-automatically. Qflow analysis is integrated as part of MR Cardiac Suite allowing flow and functional analysis in one suit with combined reporting.
Benefits
- Quantification includes the following parameters: stroke volume, regurgitant fraction, forward and backward flow volumes, flux, stroke distance, mean velocity, maximum velocity, minimum velocity, peak velocity, vessel area, peak pressure gradient, E/A ratio and deceleration time.
- The application supports manual background Correction (BC) to correct for phase (velocity) offset.
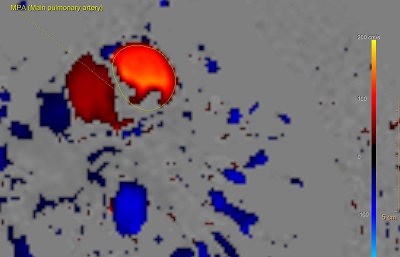
Visualize and quantify blood flow